Estimating Daily Earnings From a Pool Statistics Page
A pool statistics page is a calculator waiting to be finished. Three published values — your hashrate, pool hashrate and network hashrate — plus the difficulty figure of 132.76 T are enough to estimate a single 400 TH/s rig at about 0.000179 BTC a day, roughly $15.20 at $84,692, before any fee and before a single kilowatt-hour is priced in.

Key takeaways
- Daily BTC before fees = 450 × (your hashrate ÷ network hashrate). At 1,003 EH/s, that is about 0.000179 BTC for a 400 TH/s machine.
- Apply the listed fee to the right line: 4% on the PPS-settled block-reward component, 2% on the transaction-fee component, which brings $15.20 down to roughly $14.59.
- Hardware efficiency decides whether the estimate survives contact with the electricity bill: the same 400 TH/s rig returns +$3.07 a day at 20 J/TH, +$0.19 at 25 J/TH and minus $2.69 at 30 J/TH.
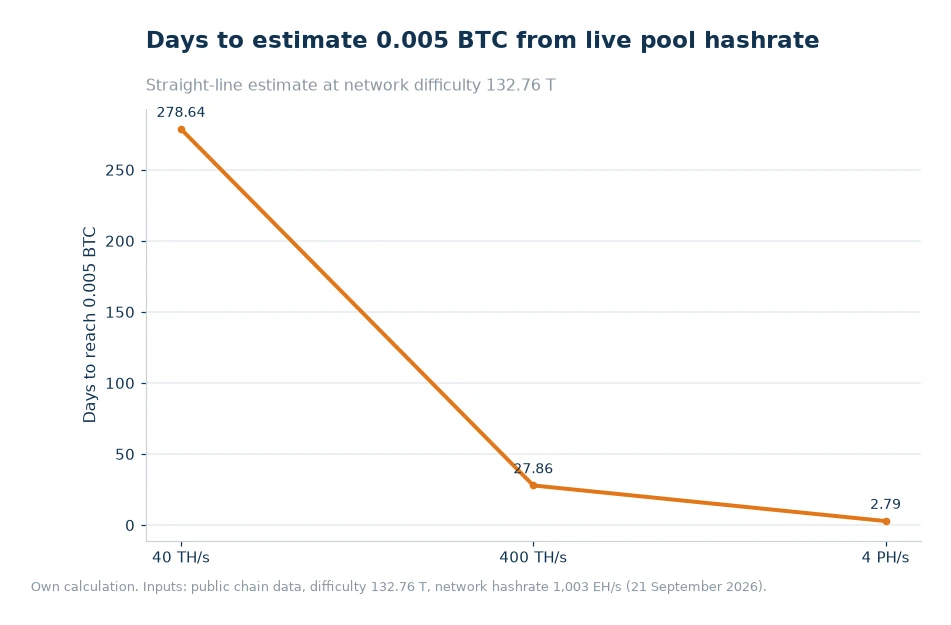
- Reaching 0.005 BTC takes about 2.8 days at 4 PH/s, 27.9 days at 400 TH/s and 279 days at 40 TH/s.
Context in 2026
Two facts shape every estimate. First, the network hands out a fixed 450 BTC a day: 3.125 BTC of subsidy per block and 144 blocks a day, about $38.1 million at today's price. Second, that fixed pool of issuance is divided by an enormous and growing denominator — network hashrate near 1,003 EH/s, with difficulty at 132.76 T and an estimated -2.12% change due at the next adjustment. An estimate that ignores either number goes stale within two weeks.
The reason a statistics page is the right starting point is that pool hashrate and network hashrate are on the same page, at the same moment, from the same source. Reading them together removes the most common source of error in mining forecasts, which is mixing a pool figure captured last month with a network figure read today.
The two variables that matter
Your share, and the pool's share
Expected daily income is a chain of proportions. Your hashrate divided by network hashrate gives your share of the network's 450 BTC. Alternatively, your hashrate divided by pool hashrate gives your share of the blocks the pool finds, which is exactly what the pool's accounting does. Both routes must agree, and when they do not, one of the four numbers you are using is out of date.
The fee, applied to the right component
The second variable is the fee, and it is where estimates usually break. A pool that lists 4% has applied it to the block-reward component that is settled per share; the transaction-fee component is distributed with PPLNS logic at a listed 2%. Treating the headline as a flat haircut overstates the cost, while treating it as zero understates it. The published breakdown exists precisely because that distinction keeps getting flattened into one number.[1
| Hardware efficiency | Power draw | kWh per day | Power cost per day | Net income per day | Contribution |
|---|---|---|---|---|---|
| 20 J/TH | 8 kW | 192 | $11.52 | $14.59 | +$3.07 |
| 25 J/TH | 10 kW | 240 | $14.40 | $14.59 | +$0.19 |
| 30 J/TH | 12 kW | 288 | $17.28 | $14.59 | minus $2.69 |
Numbers from a real rig
Take a single 400 TH/s machine and run the whole chain. Daily gross output is 450 BTC × (400 ÷ 1,003,107,267,295), which is 0.0001794 BTC — $15.20 at $84,692. After the listed 4% fee on the block-reward component, about $14.59 remains. That is the number most estimates stop at, and it is only useful if the machine is free to run.
Now price the power. At 25 J/TH the unit draws 10 kW, or 240 kWh a day, which costs $14.40 at $0.06/kWh — leaving 19 cents a day of contribution. A ten-cent move in the power price either doubles that margin or erases it. At 20 J/TH the same rig clears $3.07 a day, and at 30 J/TH it loses $2.69 a day while still producing the same 0.000179 BTC, because efficiency changes cost, not output.
That is the practical reason to build the estimate from the statistics page rather than from a hashrate marketing sheet. The output side of the equation is public and identical for everyone; the cost side is specific to your hardware and your power contract, and it is the side that decides whether the machine should be running at all this month.
Scale the same rig to a facility and the numbers get serious. A 4 PH/s site produces 0.001794 BTC a day, about $151.97 gross, or $145.89 after the listed 4% fee. Days to reach 0.005 BTC fall from 279 at 40 TH/s to 27.9 at 400 TH/s and 2.8 at 4 PH/s — which is simply the same relationship, moved two decimal places in each direction.
Decision guide
- Rebuild the estimate weekly. Difficulty moves about every two weeks, and pool hashrate moves daily. A monthly model is a lagging indicator in a market that reprices itself fortnightly.
- Compare per machine, not per fleet. Averages hide the units that have already crossed into negative contribution. Per-worker hashrate versus a recorded fingerprint finds them in one pass.
- Check the model before the invoice. A live miner profitability ranking does the same arithmetic across ASIC models at current price and difficulty, which is faster than rebuilding the sheet for every candidate machine.
- Cross-check with a second method. An income calculator takes coin price, difficulty, fee rate and valid hashrate and returns estimated daily earnings including merged-mining output — a useful second opinion on your own numbers.
- Decide on the margin, not the output. At 25 J/TH the contribution is 19 cents a day and one difficulty adjustment can remove it. Set a rule for what margin justifies keeping a model plugged in.
- Re-read the settlement terms. PPS+ credits hourly against current difficulty; PPLNS pays per block after six confirmations. Two machines with identical estimates can have very different cash flows.
The estimate is only as good as the inputs, and the inputs are all published in one place. The ViaBTC BTC Mining Pool state page shows pool hashrate, network hashrate, difficulty and miner counts per coin, so the arithmetic above can be repeated whenever those four series move rather than when a report is due.
Frequently asked questions
Is a bigger pool always better?
Size reduces payout variance but also concentrates hashrate. What matters more is fee structure, uptime, latency and payout cadence.
What happens if my miner goes offline?
Shares stop, so expected income stops with them. Alerts and a dashboard that shows per-worker hashrate shorten the gap between a failure and a fix.
How precise is a daily estimate built from a statistics page?
Within a single difficulty round it is tight, because the inputs are published and the formula is linear. Beyond two weeks it drifts: the next adjustment was estimated at -2.12% when this was written, and pool hashrate changes daily.
Does merged mining change the estimate?
Yes. Merged mining lets a machine secure a parent chain and an auxiliary chain together, so a rig pointed at a parent chain can also produce output on an auxiliary one. Most manual estimates omit it, which is one reason a calculator that includes merged-mining output is a useful cross-check.
Turn the page into a weekly number
Bookmark the three inputs, write the two-line formula next to them, and run it every Monday for each machine model you own. The exercise takes minutes and it converts a statistics page from a status display into a decision tool: which rigs earn their power this week, which ones need a firmware or thermal fix, and which ones are better switched off until the difficulty cycle turns. Numbers that are cheap to recompute get recomputed — and in mining, that habit is the difference between a spreadsheet and a losing position.
Data and sources: ViaBTC fee and pricing documentation[1]. Network difficulty (132.76 T), network hashrate (1,003 EH/s) and the BTC price of $84,692 come from public chain data and market feeds read on 21 September 2026; all output, fee, power and contribution figures above are own calculations from those inputs and move with difficulty, price and hardware efficiency.